Definition: The distractor point biserial correlation measures the reliability of each question’s answer choices. You would expect students who score well on the test to select the correct answer choice for each question. Students who do not score well on the test to, on average, select an incorrect answer choice for each question.
The distractor point biserial correlation ranges from a low of -1.0 to a high of +1.0. The closer an incorrect answer choice’s distractor point biserial correlation is to -1.0 the more reliable the answer choice is considered because it discriminates well among students who did not score well on the test and those who did. An effective distractor is one that is chosen by students who score low on the test overall.
Note: Sample size for each each distractor is much smaller then the sample size of the overall test; therefore, the distractor analysis might be less stable.
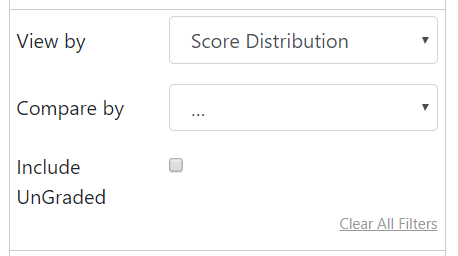
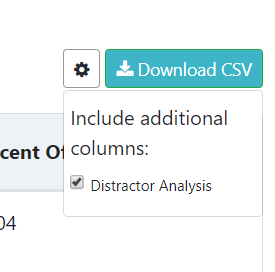
How to Find: Within the assessment dashboard, select the course (if applicable) and assessment that you would like to evaluate. On the “View by” filter, select “Score Distribution.” You will see the bar charts of performance percentage and can download those as a CSV file. There is a little gear icon next to the “Download CSV file.” Click on this and add the column titled “Distractor Analysis” to your CSV download.
Note: This data can also be found on the Distractor Analysis tab located on the Exam Statistics report. Click here to learn how to download the Exam Statistics report.
— Back to Item Analysis Help
— Back to Insights Help