Learning Outcome (“LO”) Reports show the percent accuracy (score) on questions tagged with a particular learning outcome. LO reports can be viewed as bar charts and tables, and also downloaded as images or CSV files.
Watch a video demo about pulling learning outcome reports by student cohorts.
How can you generate LO Reports?
See the tips below for how to generate the most commonly requested reports:
View by Outcome, Assessment, Question, and Answer Choice
Learning Outcome reports default to a view showing every single learning outcome, alphabetized by outcome. To make the report easier to navigate, you should filter by your desired learning outcome first, before filtering by any particular student cohort.
Step 1: Click on Learning Outcomes Report from the Insights homepage.

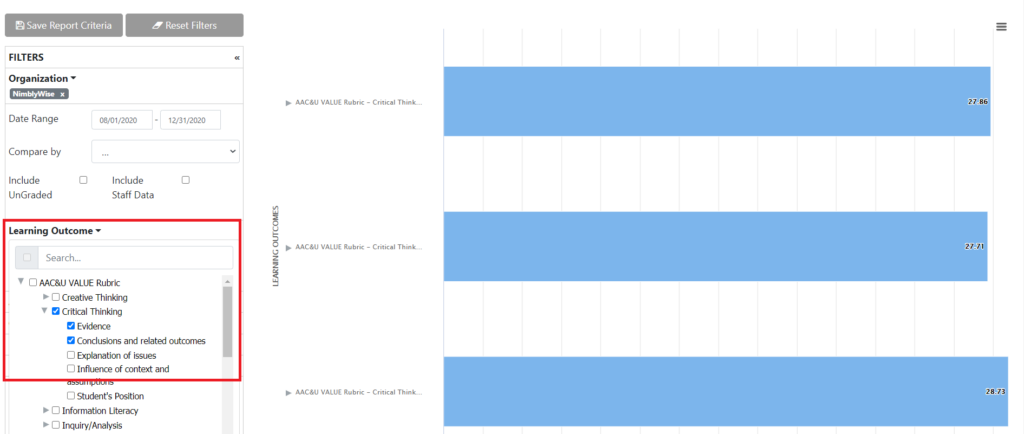
Step 2: First select your desired learning outcome under the Learning Outcome filter. Every outcome shows up as unchecked, so you need to select the parent outcome and the particular sub-outcomes you need.
- Pro-Tip: To see the entire text of the learning outcome in the bar chart, click on the arrow to the left of the name.
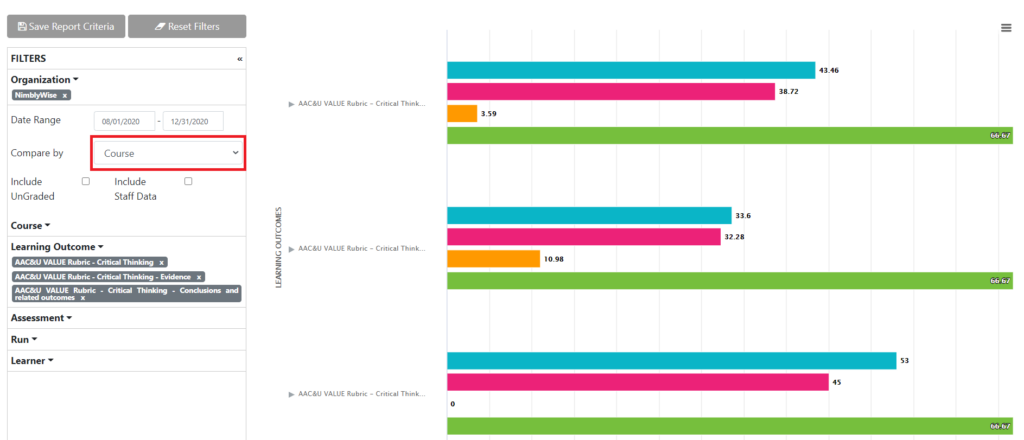
Step 3: Change the “Compare by” filter to compare two different student cohorts (e.g. course section or term).
Step 4: If you scroll down below the bar charts, you will see a table with the detailed submission information:
- Learning Outcome
- Number of scores submitted for that outcome
- Percent correct on questions tagged with that outcome

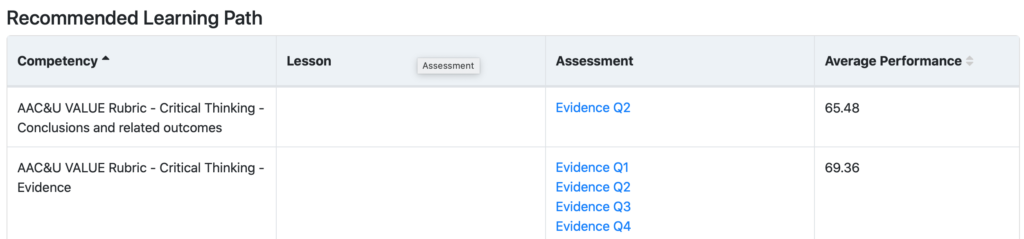
Step 5: Below the table of information, there is a recommended learning path that takes into account the performance scores on a particular learning outcome and recommends NimblyWise content that can help remediate.
— Back to Insights Help