Assessment reports show the percent accuracy (score) on any assessment for all students who have attempted it. Assessment reports can be viewed as bar charts and tables, and also downloaded as images or CSV files.
How can you generate Assessment Reports?
See the tips below for how to generate the most commonly requested reports:
View by Assessment, Question, and Answer Choice
Assessment reports default to View by Assessment, showing the total average score of each assessment selected. Click on the “View by” dropdown option on the left side to change the data displayed to view scores for each question or percentages of answer choices selected for each question.
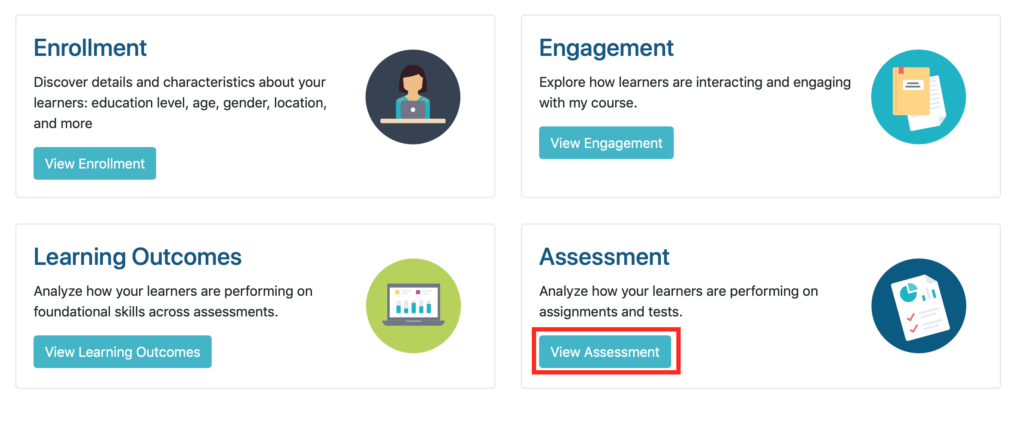
Step 1: Click on View Assessment from the Insights homepage.
Step 2: Set your filters to locate the particular class, term, assessment, and student email that you are searching for.
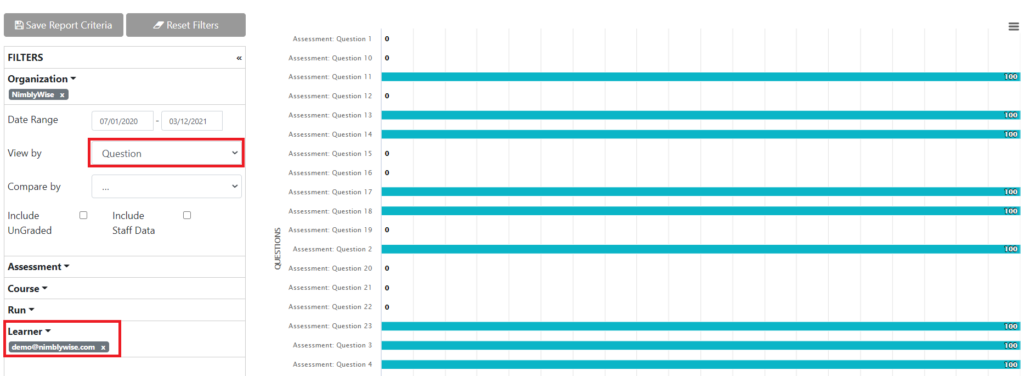
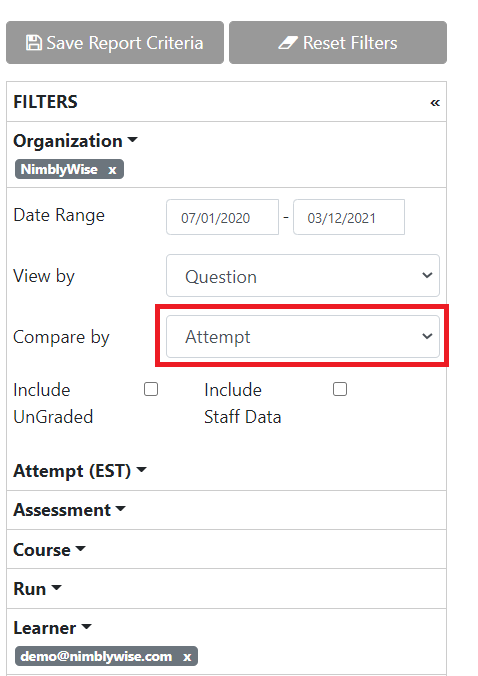
Step 3: Change the “View by” filter to “Question” – if the student has used more than one attempt, you can change the “Compare by” filter to “Attempt” to view the different question attempts.
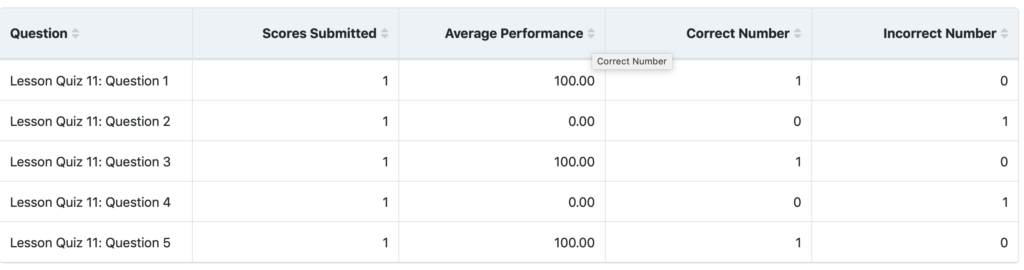
Step 4: If you scroll down below the bar charts, you will see a table with the detailed submission information:
- Question number or title
- Attempt timestamp (if applicable)
- Number of responses submitted (most useful for multiple response questions)
- Percent correct on that question
- Number of correct responses
- Number of incorrect responses
After each attempt on a particular question, the table will provide a total attempt average for that particular question.
— Back to Insights Help